数据可视化入门-d3绘制分形二叉树

marvin
在 svg 的标签中 line 表示直线, 通过直线就可以绘制各种图形了, 比如坐标系, 多边形等, 那如何用 svg 绘制一棵树呢?
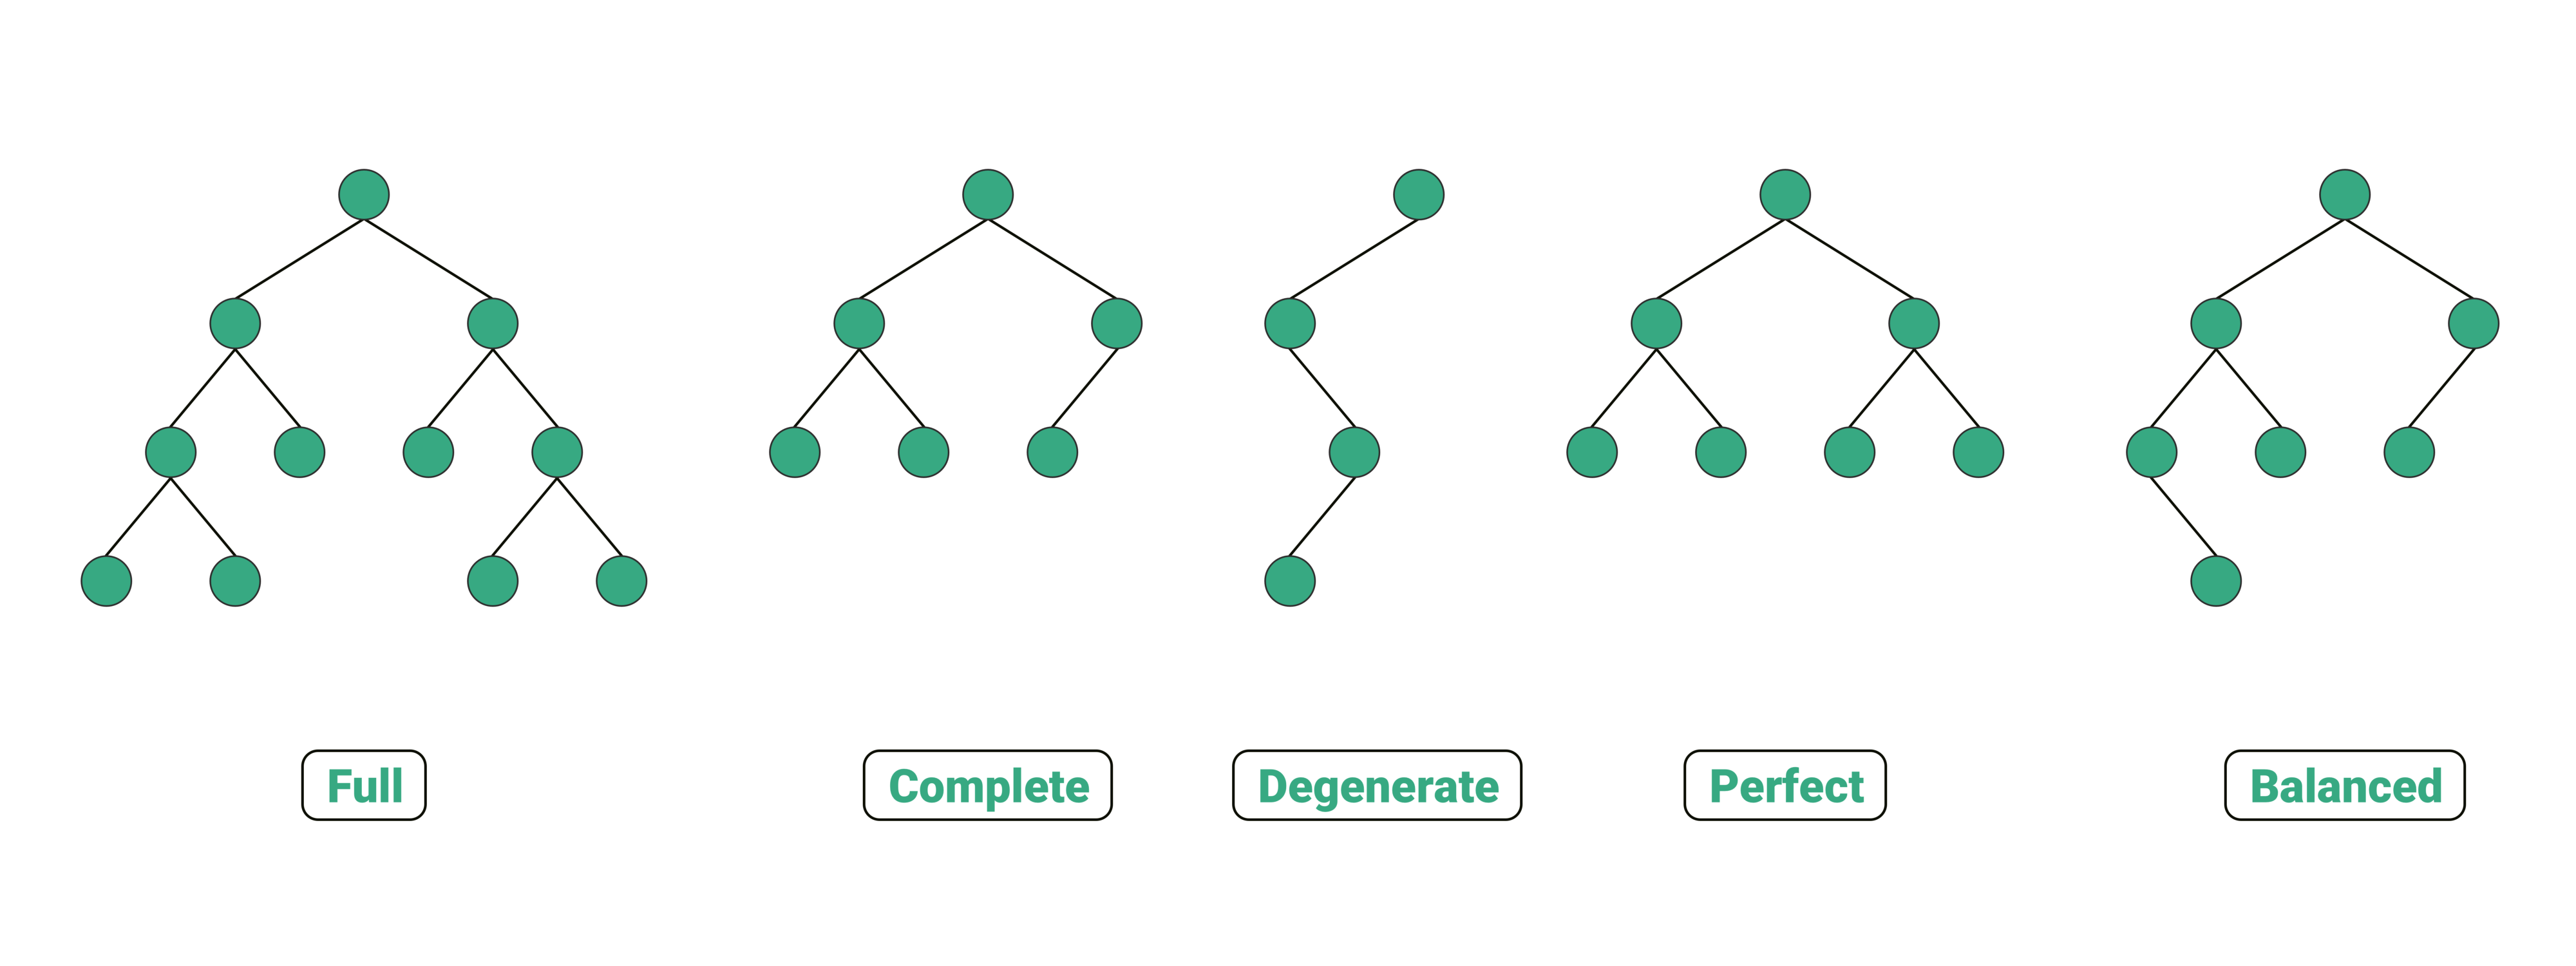
树的基本形态是由下到上生长, 且枝干的长度是越来越短的, 分叉之间都存在一定的角度, 主枝干和分枝干拥有基本相似的结构, 其符合递归的思路
接下来, 只需要通过递归去生成这么一棵树即可
树的基本参数配置
const length = 200;
const reduceRate = 0.6;
const radius = -Math.PI / 2;
const count = 7;
这里的 length 是树的主枝干的长度, reduceRate 是用于计算枝干的长度的, 每生成一层, 枝干的长度都按照这个衰减率减少, radius 设置为 -Math.PI / 2, 因此主枝干的终点位置将在垂直向上的方向上, count 为递归绘制的次数
绘制树
首先绘制主枝干, 代码如下:
const show = (x0, y0, length, reduceRate, radius) => {
  const x1 = x0 + length * Math.cos(radius);
  const y1 = y0 + length * Math.sin(radius);
  svg.append('line')
    .attr('x1', x0)
    .attr('y1', y0)
    .attr('x2', x1)
    .attr('y2', y1)
    .attr('style', 'stroke: rgb(99, 99, 99); stroke-width: 2')
}

show(rootRef.current.offsetWidth / 2, 500, length, reduceRate, radius);
这里我们已容器的底部的中间为起点, x0 为容器的宽度的一半, y0 为容器的高度, 终点为 x0 加上当前长度的cos偏移量, y1 为 y0 加上当前长度的 sin 偏移量, 当 radius 为 -Math.PI / 2 时, x1 刚好等于 x0, y1 刚好为起点位置向上走 length 长度的距离, 然后通过 line 的 x1, y1, x2, y2 的属性分别设置起点和终点坐标, 并设置绘制边线的样式
接下来还需要绘制左右枝干, 需要计算左边的偏移角度和右边的偏移角度, 以便计算枝干的终点位置, 然后需要重新计算枝干的长度, 更改如下:
const show = (x0, y0, length, reduceRate, radius, count) => {
  const x1 = x0 + length * Math.cos(radius);
  const y1 = y0 + length * Math.sin(radius);
  svg.append('line')
    .attr('x1', x0)
    .attr('y1', y0)
    .attr('x2', x1)
    .attr('y2', y1)
    .attr('style', 'stroke: rgb(99, 99, 99); stroke-width: 2')

  const radiusLeft = radius - Math.PI / 4;
  const radiusRight = radius + Math.PI / 4;

  if(count > 0) {
    show(x1, y1, length * reduceRate, reduceRate, radiusLeft, count - 1);
    show(x1, y1, length * reduceRate, reduceRate, radiusRight, count - 1);
  }
}

show(rootRef.current.offsetWidth / 2, 500, length, reduceRate, radius, count);
这里 x1, y1 为当前枝干的终点位置, 同时也是新的左右枝干的起点位置, 新的长度为当前长度乘以衰减率, 由于递归需要一个出口, 这里传入一个迭代次数, 控制递归最多7层
写在最后
分形二叉树是递归的一种艺术展现, 并没有特别大的实际用途, 但可以帮助我们更好的理解 svg 和 d3 的应用, 以上
本文完整代码
import React, { useEffect, useRef } from 'react';
import * as d3 from 'd3';

const FractalBinaryTree = () => {
  const rootRef = useRef();

  useEffect(() => {
    const svg = d3.select('.fractal-binary-tree-root svg')

    const length = 200;
    const reduceRate = 0.6;
    const radius = -Math.PI / 2;
    const count = 7;

    const show = (x0, y0, length, reduceRate, radius, count) => {
      const x1 = x0 + length * Math.cos(radius);
      const y1 = y0 + length * Math.sin(radius);
      svg.append('line')
        .attr('x1', x0)
        .attr('y1', y0)
        .attr('x2', x1)
        .attr('y2', y1)
        .attr('style', 'stroke: rgb(99, 99, 99); stroke-width: 2')

      const radiusLeft = radius - Math.PI / 4;
      const radiusRight = radius + Math.PI / 4;

      if(count > 0) {
        show(x1, y1, length * reduceRate, reduceRate, radiusLeft, count - 1);
        show(x1, y1, length * reduceRate, reduceRate, radiusRight, count - 1);
      }
    }

    show(rootRef.current.offsetWidth / 2, 500, length, reduceRate, radius, count);
  }, []);

  return (
    <>
      <h1 className="text-center">分形二叉树</h1>
      <div className="fractal-binary-tree-root" style={{height: 500}} ref={rootRef} >
        <svg
          width="100%"
          height="100%"
        />
      </div>
    </>
  )
}

export default FractalBinaryTree;